Stock Market Trading & Investing Blog
Loading...
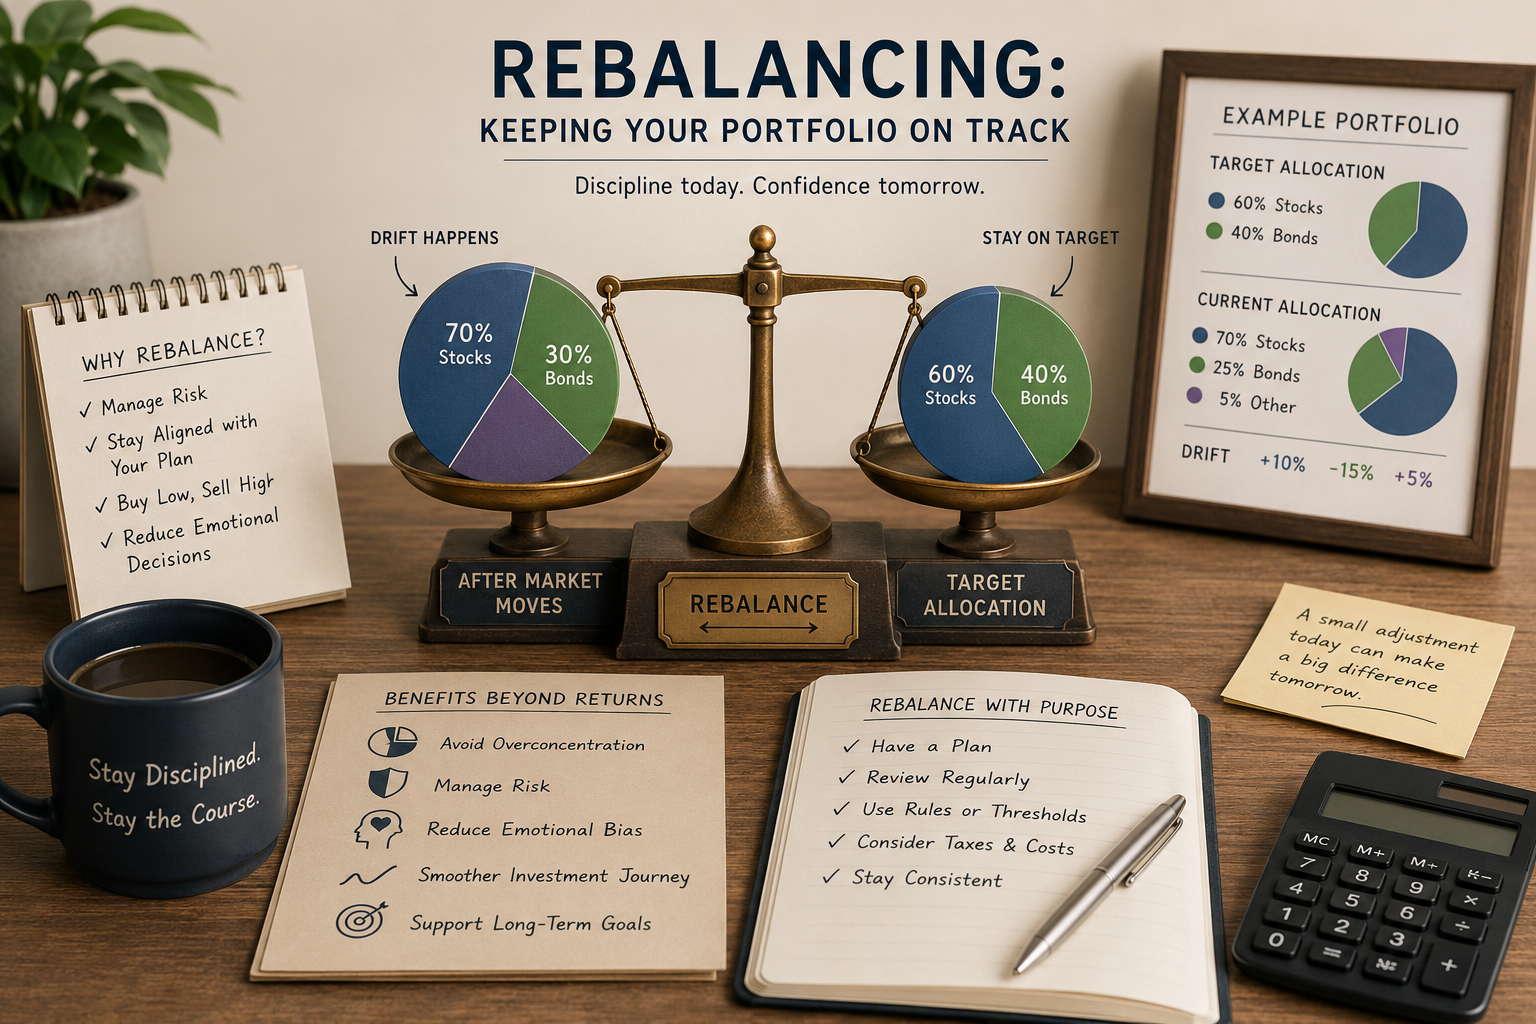
The Quiet Discipline of Rebalancing
Rebalancing is rarely the most exciting topic in investing circles. It doesn’t generate headlines or spark debates like stock picking or market timing. Yet, for those committed to long-term investing success, rebalancing is one of the quiet disciplines that can make all the difference between a portfolio that survives and one that thrives. Understanding the Role of Rebalancing At its core, rebalancing is the process of realigning your portfolio’s asset allocation back to its original targets. Over time, as markets move, certain assets will outperform while others lag. Left unchecked, this drift can expose you to unintended risks and potentially undermine your investment goals. For example, a portfolio that started as 60% stocks and 40% bonds may morph into 70% stocks after a strong bull market—leaving you more exposed to equity risk than
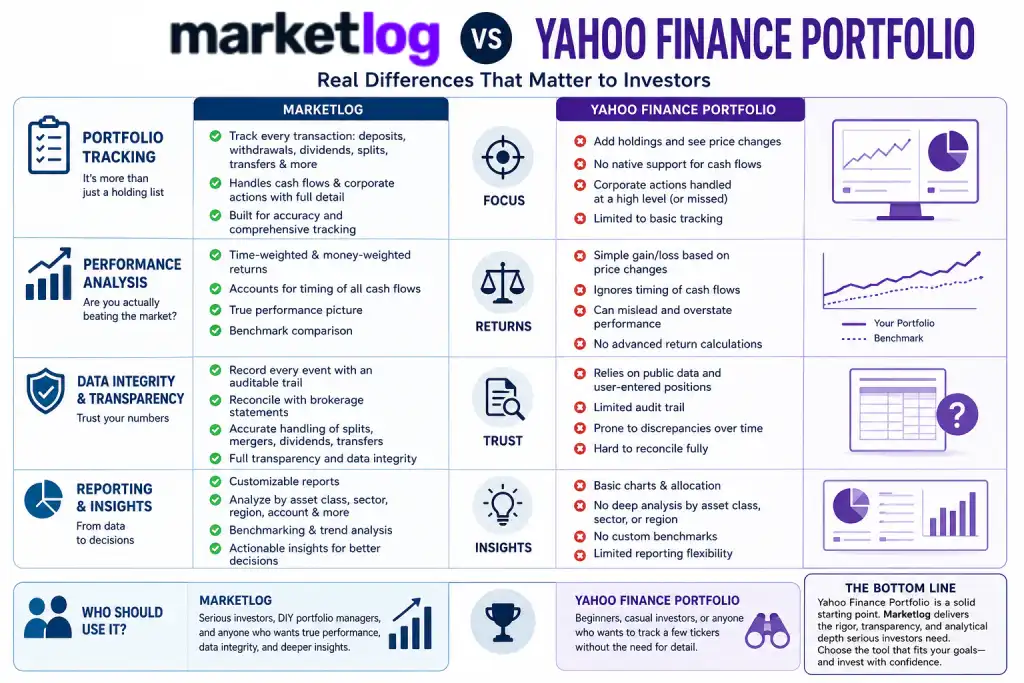
Marketlog vs Yahoo Finance Portfolio: Real Differences
Comparing Marketlog and Yahoo Finance Portfolio is more than a matter of interface preferences or brand loyalty. For investors who care about accurate portfolio tracking, meaningful performance analysis, and actionable insights, the differences run deep. Here’s a side-by-side look at what truly separates Marketlog from Yahoo Finance Portfolio—and why those differences matter when your money is on the line. Portfolio Tracking: Beyond Just Holding Lists Yahoo Finance Portfolio’s appeal lies in its simplicity. You can quickly add stocks, ETFs, or mutual funds, see current prices, and get a snapshot of your holdings. For casual tracking or a basic watchlist, this approach is fine. But for investors who want to track every deposit, withdrawal, dividend, split, or transfer, Yahoo’s tool falls short. It doesn’t natively handle cash flows or corp
What “Annualized Return” Actually Tells You
Annualized return is a fundamental metric in investing, yet its true significance is often misunderstood. For investors managing their portfolios or analyzing performance, grasping what annualized return represents and what it does not is crucial for making informed decisions. This article explores the concept of annualized return, clarifies common misconceptions, and explains how investors can use it effectively within portfolio management. Defining Annualized Return Annualized return, sometimes referred to as the compound annual growth rate (CAGR), represents the average yearly return an investment achieves over a specified period. This metric smooths out the effects of market volatility and irregular gains or losses, providing a single consistent rate that equates to the total growth if the investment had grown steadily year after year

NYSE, NASDAQ, and the World’s Biggest Exchanges Explained
The global financial landscape is anchored by several key stock exchanges, each playing a critical role in capital markets and investment opportunities. Among these, the New York Stock Exchange (NYSE) and the NASDAQ stand as two of the most influential in the United States, while other global exchanges contribute significantly to international trading and investment. Understanding these venues is essential for investors seeking to navigate the complexities of long-term investing and global portfolio management. The New York Stock Exchange (NYSE) The NYSE, often referred to as the “Big Board,” is the largest stock exchange in the world by market capitalization. Established in 1792, it has a long-standing reputation for hosting many of the largest and most established companies globally. This historic exchange combines a traditional physica


When Inflation Quietly Changes Your Allocation
Inflation is commonly referenced in economic discussions as a headline figure influencing the broader economy, but its nuanced effects on portfolio allocation often go unnoticed. Investors who fail to adjust their asset distribution in response to inflationary pressures may inadvertently experience shifts in their intended risk and return profile without making explicit changes. Recognizing how inflation silently alters allocation is crucial for maintaining a disciplined and effective investment strategy over extended periods. The Invisible Shift in Asset Allocation Portfolio allocation is fundamentally established based on an investor’s financial objectives, risk tolerance, and perspective on market conditions. While it is inherently a dynamic process, adjustments tend to occur primarily when market movements are conspicuous or when new

How to Know If a Stock Is Carrying or Hurting You
Determining whether a stock is contributing positively or negatively to an investment portfolio is a critical skill for any serious investor. This evaluation goes far beyond merely observing price appreciation or decline. An experienced investor recognizes that understanding a stock’s true impact requires a comprehensive approach, which includes performance analysis, risk management, and ensuring alignment with the overall portfolio goals and strategy. Understanding the Role of Individual Stocks in a Portfolio Every stock within a portfolio carries a certain weight, both in terms of allocation and its influence on overall returns. A well-performing stock can carry the portfolio forward by generating returns that enhance the total portfolio value. Conversely, a poorly performing stock can hurt the portfolio by dragging down aggregate perfo

The Habit That Makes Portfolio Tracking Powerful
Effective portfolio management hinges not only on the tools investors use but also on the habits they cultivate. Among these habits, consistent and disciplined portfolio tracking stands out as a cornerstone of successful long-term investing. This practice empowers investors to make informed decisions grounded in data, behavioral awareness, and clear financial goals. By integrating portfolio tracking as a habitual part of their investment routine, investors gain the ability to observe trends, manage risks, and respond strategically to changing market conditions. At its core, portfolio tracking is more than just monitoring numbers. It is about creating a routine that fosters vigilance without succumbing to impulsive reactions. Behavioral finance research emphasizes that emotional responses to market fluctuations often undermine investment s

How to Read Your Performance Graph Correctly
Performance graphs serve as indispensable tools for investors aiming to track and understand the progression of their investments over time. These visual representations allow investors to observe changes in portfolio value and returns, but interpreting them accurately requires more than a simple glance at moving lines or fluctuating bars. Experienced investors recognize that correctly reading performance graphs involves a thorough understanding of the underlying metrics, an awareness of external influences, and the ability to place the data within the context of one’s overall investment strategy. Understanding the Basics of Performance Graphs At their essence, performance graphs depict the change in value of an investment or a portfolio over a specified period. This change can be illustrated in absolute dollar amounts or as percentage ga

From Random Picks to Real Strategy
Investing without a clear plan often leads to inconsistent results. Many new investors begin their journey by selecting stocks on impulse, influenced by fleeting trends or hearsay rather than a well-considered strategy. Over time, experienced investors come to understand that a deliberate approach to portfolio management is essential for achieving long-term growth while controlling risk effectively. The transition from making random picks to adopting a structured investment strategy starts with grasping the fundamentals of portfolio construction and recognizing the importance of aligning investments with personal financial goals. An effective strategy takes into account crucial factors such as asset allocation, diversification, risk tolerance, and investment time horizon. This approach replaces guesswork and impulsive decisions with infor

What Drawdown Feels Like and What It Actually Means
Drawdown is a term every investor encounters but few fully grasp beyond the immediate emotion it evokes. It refers to the decline from a portfolio's peak value to its lowest point over a certain period. While the concept is straightforward, the experience of a drawdown often triggers anxiety and doubt, especially during volatile markets. Understanding what drawdown truly means for portfolio management and risk assessment is essential for any serious investor seeking to build resilience and achieve long-term financial goals. The Emotional Impact of Drawdowns Experiencing a drawdown can feel like a setback or even a failure. For many investors, watching account values fall below previous highs stirs worry about permanent losses and financial security. This emotional response is natural but can cloud judgment and lead to irrational decision-

How to Read Your Performance Graph Correctly
Performance graphs serve as indispensable tools for investors aiming to track and understand the progression of their investments over time. These visual representations allow investors to observe changes in portfolio value and returns, but interpreting them accurately requires more than a simple glance at moving lines or fluctuating bars. Experienced investors recognize that correctly reading performance graphs involves a thorough understanding of the underlying metrics, an awareness of external influences, and the ability to place the data within the context of one’s overall investment strategy. Understanding the Basics of Performance Graphs At their essence, performance graphs depict the change in value of an investment or a portfolio over a specified period. This change can be illustrated in absolute dollar amounts or as percentage ga

The First Time You Compare Yourself to the Market
For many investors, the moment they first compare their portfolio’s performance to the broader market marks a significant turning point in their investing journey. This initial comparison often brings clarity, humility, and a deeper understanding of what it truly means to manage investments effectively. It is not merely about measuring returns; it involves evaluating one’s investment strategy, risk tolerance, and expectations within a realistic and informed context. Why Benchmarking Matters Benchmarking a portfolio against a market index or a relevant sector benchmark is a fundamental practice in portfolio management. Investors frequently use indices such as the S&P 500, Dow Jones Industrial Average, or other broad market indicators as a yardstick to gauge how well their investments are performing relative to the overall market. Without t

Building a Portfolio You Can Sleep With
Constructing an investment portfolio that offers peace of mind requires more than just selecting assets with the highest potential returns. It demands a disciplined and thoughtful approach that encompasses effective risk management, strategic asset allocation, and adherence to long-term investing principles. Experienced investors recognize that a well-balanced portfolio is designed not only for growth but also to minimize volatility and safeguard capital during periods of market uncertainty. The Importance of Risk Management Risk management serves as the foundation of a portfolio that investors can hold comfortably without experiencing sleepless nights. This process involves identifying potential risks, measuring their impact, and implementing strategies to mitigate them effectively. One of the most essential risk management techniques is

Marketlog vs Sharesight: What Serious Investors Notice
Serious investors rely on accurate and reliable tools to manage and analyze their portfolios effectively. Among the many options available in the market today, Marketlog and Sharesight have emerged as popular choices for portfolio tracking and performance analysis. However, discerning investors recognize key differences between these two platforms that significantly influence their decision-making process when selecting the most suitable tool for their investment needs. Core Functionality and User Experience Both Marketlog and Sharesight provide essential portfolio tracking capabilities, allowing users to monitor the performance of their investments over time. Sharesight is widely appreciated for its user-friendly interface and automated data import features, which can be particularly appealing to investors who seek simplicity and conveni

The Psychology of Checking Your Portfolio Too Often
In the realm of investing, keeping an eye on one’s holdings is undeniably important. However, a growing trend among investors is the compulsive and frequent checking of their portfolios. This behavior is often driven more by psychological impulses than by sound investment strategies. Such frequent monitoring may lead to unintended consequences that negatively impact decision-making and ultimately, long-term portfolio performance. Gaining a deeper understanding of the psychological factors behind this tendency is vital for investors who aim to maintain discipline and avoid emotional mistakes that can derail their financial goals. Behavioral Finance and Investor Psychology Behavioral finance is the study of how cognitive biases, emotions, and psychological influences affect financial decision-making. One prominent bias that contributes to f

What Is CAGR and Why Long-Term Investors Care
Compound Annual Growth Rate, commonly known as CAGR, is a crucial metric that long-term investors rely on to assess how their investments have grown over a period of time. Unlike simple averages that can be skewed by fluctuations in returns, CAGR provides a smoothed, annualized growth rate that accounts for the impact of compounding. This makes it an invaluable tool for gaining a clearer and more accurate understanding of an investment’s true growth trajectory. For anyone serious about portfolio management and performance analysis, mastering the concept of CAGR is essential. Defining CAGR CAGR stands for Compound Annual Growth Rate and represents the constant rate at which an investment would have grown if it had expanded steadily over a given timeframe. Essentially, it eliminates the distortions caused by year-to-year volatility by prese
Dividend Dates Explained Without Confusion
Dividend investing remains a foundational strategy for investors aiming to generate steady income streams while building long-term wealth. By systematically acquiring shares of companies that distribute earnings through dividends, investors can enjoy both passive income and the potential for capital appreciation. However, the process of dividend distribution involves several key dates, namely, the declaration date, ex-dividend date, record date, and payment date, that can often lead to confusion for those new to dividend investing. Understanding these dates is critical for maximizing returns, avoiding common mistakes, and efficiently managing investment portfolios. This article provides a clear and detailed explanation of each dividend date, enabling investors to confidently navigate the dividend payment cycle. What Are Dividend Dates? Di

Why Tracking Small Accounts Still Matters
In the world of investing, the size of an account often influences the level of attention it receives. Large portfolios with substantial capital tend to dominate headlines and investor focus. However, small accounts, those with limited initial capital, deserve just as much consideration. Dismissing these accounts as insignificant overlooks the valuable lessons and long-term benefits they offer. Tracking small accounts remains a crucial practice for investors committed to disciplined portfolio management and steady growth over time. The Importance of Discipline in Small Accounts One of the primary advantages of managing and tracking a small account is the opportunity to develop disciplined investing habits. When capital is limited, every decision carries more weight because mistakes have a relatively larger impact on the overall portfolio.

How Exchange Listings Affect Your Investments
Exchange listings play a significant role in shaping the investment landscape for both individual and institutional investors. Understanding how the choice of stock exchange impacts the performance, liquidity, and regulatory environment of a security is essential for effective portfolio management. Many investors tend to focus primarily on the fundamentals of stocks themselves, such as earnings, growth prospects, and dividends. However, the exchange on which these stocks trade can influence risk, costs, and opportunities in subtle but meaningful ways that deserve careful consideration. The Importance of Stock Exchange Listings When a company decides to go public, the choice of the exchange for its initial listing is a strategic decision that can affect its future trajectory. Major exchanges like the New York Stock Exchange (NYSE) and NASD

Time-Weighted vs Money-Weighted Returns (Without Math Panic)
Understanding investment performance is a critical skill for both professional portfolio managers and individual investors. When assessing how well an investment has done, it is important to use the right metrics. Among the various ways to measure returns, time-weighted and money-weighted returns are two fundamental approaches that provide distinct insights. Each method serves a unique purpose and reveals different aspects of an investment’s performance. This article aims to clarify these concepts in straightforward terms, avoiding complex mathematics, so that investors can interpret their results with greater confidence and accuracy. What Are Time-Weighted Returns? Time-weighted return (TWR) is a performance measure that calculates the compound rate of growth of one unit of currency invested over a specific period, regardless of any addi

What Drawdown Feels Like and What It Actually Means
Drawdown is a term every investor encounters but few fully grasp beyond the immediate emotion it evokes. It refers to the decline from a portfolio's peak value to its lowest point over a certain period. While the concept is straightforward, the experience of a drawdown often triggers anxiety and doubt, especially during volatile markets. Understanding what drawdown truly means for portfolio management and risk assessment is essential for any serious investor seeking to build resilience and achieve long-term financial goals. The Emotional Impact of Drawdowns Experiencing a drawdown can feel like a setback or even a failure. For many investors, watching account values fall below previous highs stirs worry about permanent losses and financial security. This emotional response is natural but can cloud judgment and lead to irrational decision-

From Random Picks to Real Strategy
Investing without a clear plan often leads to inconsistent results. Many new investors begin their journey by selecting stocks on impulse, influenced by fleeting trends or hearsay rather than a well-considered strategy. Over time, experienced investors come to understand that a deliberate approach to portfolio management is essential for achieving long-term growth while controlling risk effectively. The transition from making random picks to adopting a structured investment strategy starts with grasping the fundamentals of portfolio construction and recognizing the importance of aligning investments with personal financial goals. An effective strategy takes into account crucial factors such as asset allocation, diversification, risk tolerance, and investment time horizon. This approach replaces guesswork and impulsive decisions with infor

When Dividend Income Looks Better Than It Is
Dividend income has long been a favored metric for many investors seeking steady cash flow from their investments. The allure of regular payments can create a perception of consistent returns and financial security. However, this perception often obscures the complex realities behind dividend payouts and their true contribution to overall investment performance. Understanding when dividend income looks better than it truly is can help investors make more informed decisions and avoid common pitfalls that may negatively impact their financial goals. The Appeal of Dividend Income Dividends offer a tangible cash return that investors can either reinvest to grow their holdings or use as a source of passive income. This feature makes dividend-paying stocks particularly attractive, especially for retirees or individuals who seek a reliable incom

Why Investors Overestimate Their Returns
Many investors hold the belief that their portfolios consistently outperform the market or generate impressive returns over time. However, extensive research and practical experience demonstrate that most investors routinely overestimate their investment performance. This common misjudgment stems from a combination of behavioral biases, flawed methods of performance analysis, and inadequate portfolio tracking practices. Gaining a thorough understanding of these contributing factors is crucial for investors who aim to achieve accurate self-assessment and attain long-term success in the markets. Behavioral Biases Affecting Return Perception Behavioral finance provides valuable insights into why investors often misjudge their returns. Cognitive biases such as overconfidence and confirmation bias play a significant role in skewing investors’

What Trading Hours Mean for Global Portfolios
Understanding the trading hours across global financial markets is crucial for investors who manage diversified portfolios spanning multiple countries and time zones. Each market operates according to its local schedule, and these variations significantly impact liquidity, price discovery, and the overall valuation of assets. Investors and portfolio managers who grasp these nuances can optimize their strategies, improving both portfolio tracking accuracy and asset allocation decisions. This article delves into the complexities of trading hours worldwide and their effects on managing global portfolios. The Structure of Global Trading Hours Financial markets around the world operate within defined hours closely tied to their geographic locations and local regulations. For instance, the New York Stock Exchange (NYSE) functions from 9:30 a.m.

Why Portfolio Value and Total Return Don’t Match
Investors often encounter a puzzling situation: the portfolio value they see does not align with the total return they expect. This disconnect can lead to misunderstandings about performance and misguided decisions. Understanding why portfolio value and total return don’t match is essential for any serious investor aiming to accurately assess their financial progress and make informed investment choices. Defining Portfolio Value and Total Return Portfolio value represents the current market value of all holdings within an investment account. It reflects the sum of all assets based on their latest prices, including any cash balances or equivalents held within the account. This value essentially provides a snapshot of the investor’s assets at a specific point in time. In contrast, total return measures the overall gain or loss on investment

What “Portfolio Weight” Really Shows About Risk
Understanding the role of portfolio weight is fundamental for effective risk management and asset allocation. While many investors tend to focus primarily on the absolute value of individual holdings within their portfolios, portfolio weight provides a deeper and more nuanced insight into how risk is distributed across an entire investment portfolio. This article explores what portfolio weight truly indicates about risk and why it is an indispensable concept for investors who aim to balance potential growth opportunities with the need for security and capital preservation. Defining Portfolio Weight Portfolio weight refers to the percentage that a specific asset or security represents within the total portfolio value. To illustrate, if an investor holds $10,000 worth of an asset within a portfolio valued at $100,000, that particular asset

What After-Hours Trading Means for Your Portfolio
After-hours trading has become an increasingly relevant aspect of the stock market for investors aiming to manage their portfolios effectively. Unlike regular market hours, which typically run from 9:30 a.m. to 4:00 p.m. Eastern Time, after-hours trading extends the opportunity to buy and sell securities beyond these conventional boundaries. Understanding the implications of after-hours trading is essential for investors who seek to navigate market volatility and optimize risk management strategies in an ever-changing financial landscape. The Nature of After-Hours Trading After-hours trading occurs outside of the standard exchange hours and generally includes the period from 4:00 p.m. to 8:00 p.m. ET. This session allows investors to react to news releases, earnings reports, and other market-moving events that happen after the closing bel

Understanding Dividend Yield Without Overthinking It
Dividend yield is a fundamental metric that every investor interested in dividend investing and passive income should understand. It provides a straightforward snapshot of the income generated by an investment relative to its price. Yet, many investors tend to overcomplicate the concept, which often leads to confusion and sometimes poor decision-making. This article aims to clarify dividend yield, how it is calculated, and its practical role in portfolio management without adding unnecessary complexity. What Is Dividend Yield? At its core, dividend yield measures the annual dividends paid by a company relative to its current stock price. It is expressed as a percentage and offers insight into how much cash return an investor might expect based on the current market price of the stock. This makes dividend yield a useful tool for comparing

The Danger of One “Hero” Stock
Investors often find themselves enamored with a single “hero” stock one that outperforms the market, captures headlines, and inflates portfolio returns. While such success stories can be alluring, relying heavily on one stock exposes portfolios to significant risks. This article examines the dangers of concentrating too much capital in a single equity and highlights the importance of disciplined asset allocation and risk management to build a resilient investment portfolio. The Allure of the Hero Stock In the world of stocks, standout performers occasionally transform portfolios overnight. These exceptional stocks, often dubbed “hero” stocks, can deliver spectacular gains that far exceed broader market averages. It is tempting for investors to allocate a disproportionate share of capital to these winners, hoping their momentum continues i
Load More
Loading...


