
Solana

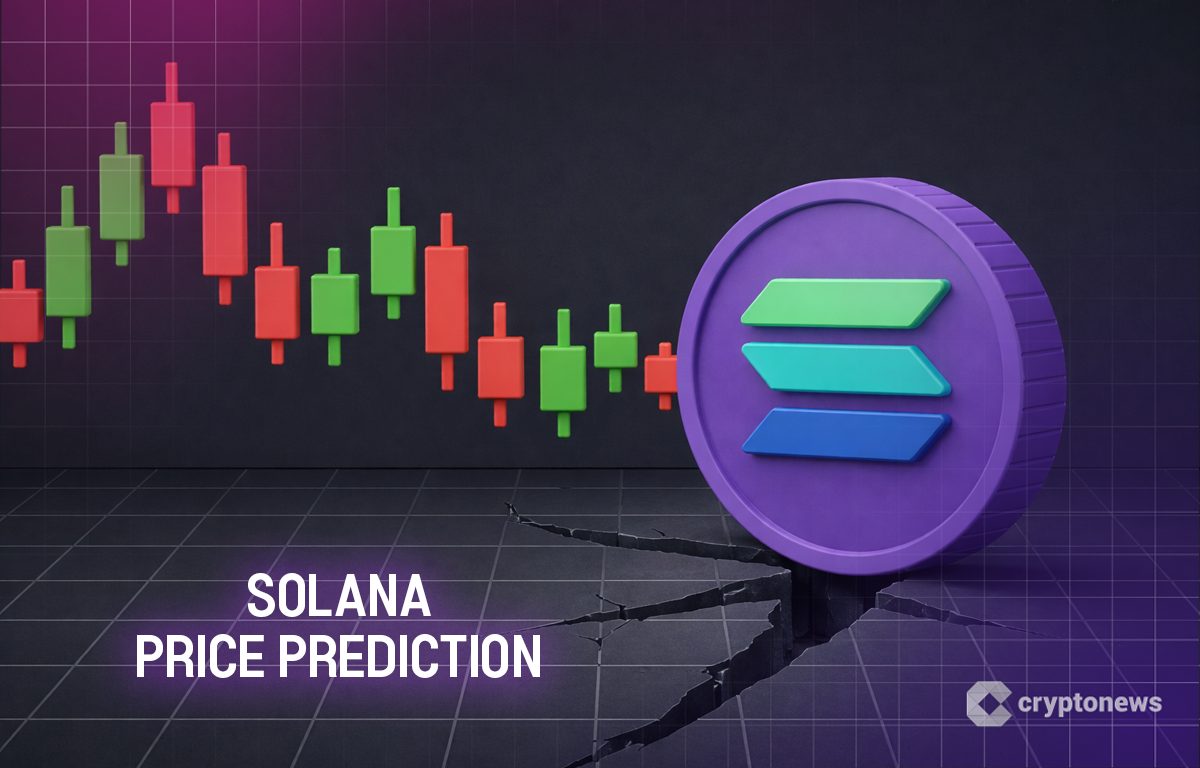
Solana Price Prediction: Bounce to $89 or Drop Toward $30
Solana price analysis shows wave B resistance near $89, while a mirror chart warns SOL could still drop toward $30.
Solana (SOL) Returns to $90 Resistance: Is a Major Breakout Finally Coming?
Solana (SOL) has returned to challenge the $90 resistance barrier, a critical price threshold that has consistently rejected upward attempts throughout February and beyond. Currently trading near $88 with a modest 2.5% gain over 24 hours, SOL briefly touched $94.21 during this recent push before retreating over 5%.

Solana (SOL) Strength Fades, Will Bulls Regain Momentum Soon?
Solana failed to settle above $90 and corrected most gains. SOL price is now consolidating losses above $85 and might attempt another increase.

Solana USD Surges +4%: Is $100 SOL Back on the Menu?
Solana trades near $85–$86 as U.S. spot SOL ETFs cross $1 billion in AUM and Goldman Sachs discloses $108 million in holdings. Here's what the chart says next.
SOL Builds Momentum Near $90 as Analysts Target $100 and Eye $120 Upside
Solana eyes a breakout above $90 as bullish momentum builds, with analysts targeting $100 and potentially $120 next.

Solana Price News: SOL Sets Eyes on $90 Again, Setting Stage for Major Breakout
Solana trading volumes hit their highest levels since March – Solana price prediction grows bullish as current setup favors a reversion to the mean.
Solana Price Prediction: SOL Has Been Rejected at $89 Three Times in a Row – Is the Fourth Attempt Finally the Breakout?
Solana trades at $86.36 with the $88–$90 supply zone blocking progress. Analysts split on breakout vs. corrective rejection — key levels, scenarios, and catalysts inside.

Solana Treasury Firms Face Deeper Losses
Solana treasury firms are facing steeper losses than Bitcoin or Ethereum peers as volatile SOL exposure and speculative investors amplify stock drawdowns.

Solana Eyes $260 Breakout as Analysts Debate Path to $1,000
Solana's price structure hints at accumulation, yet key levels near $84 and $120 will decide the next major trend direction.

Solana price forms bullish double bottom, eyes upside to over $110 on breakout
Solana price has rebounded by 6% since its Monday drop as investor confidence returns to the market.

Solana (SOL) Eyes $90 Breakout as Foundation Calls It the ‘On-Chain Nasdaq'
At present, Solana is changing hands at $86.46, backed by $4.80 billion in 24-hour trading volume and maintaining a market capitalization of $49.52 billion. While the asset has appreciated 1.80% over the last day, overhead resistance continues to cap upside momentum.

Solana Price Prediction: Breakout vs Rejection at $89
Solana tests key resistance as one chart signals breakout potential while another warns the SOL rebound remains corrective.


