



iShares Core S&P 500 ETF (IVV)







S&P 500 Snapshot: Index Closes at Record High
The S&P 500 finished the first full trading week of 2026 at a new record high. Here is a snapshot of the index from the past week: The table below summarizes the number of record highs reached each year dating back to 2013.
The S&P 500 is losing the momentum that had been fueling stock investors
Lack of follow-through to new highs is concerning but not necessarily bearish — yet.
Top 10 Charts of 2025
Now that 2025 has come to an end, let's take a look at the top 10 most-read charts of the year. From market updates and valuations to consumer attitudes and gas prices, these charts have provided crucial insights into the economic landscape that shaped the last twelve months.

It's rare for the S&P 500 and the VIX to post gains on the same day. Here's why it just happened.
The stock market has been climbing despite rising geopolitical tensions after the U.S. captured Venezuelan leader Nicolás Maduro.
S&P 500's Top Stock of 2025: Western Digital
Subscribers to Chart of the Week received this commentary on Sunday, January 4.

Micron's stock is an S&P 500 standout by this metric, as memory prices boom
Looking across the S&P 500 at unreported fiscal years, no company is expected to grow revenue faster than Micron.

The S&P 500 Bull Run Is 3 Years Old. 2026 Could Bring a New Round of Gains.
By October, the S&P 500 had rallied 98% over the 36 and a half months from its October 2022 lows.

IVV and SPYM Offer Nearly Identical S&P 500 Exposure, But Which One Is Better for Investors?
SPYM and IVV deliver nearly identical S&P 500 exposure, but SPYM is slightly more affordable on fees. IVV is much larger in assets under management, offering greater liquidity for investors.
S&P 500: Energy Drives Benchmark Higher as US Stocks Hold Key Support Level
S&P 500 rises on first trading day of 2026 as energy sector drives benchmark higher. Key 50-day moving average holds, supporting bullish forecast.

S&P 500 Could Rally for 4 Straight Years. These Are the Odds.
Bears who see a bubble are confronting the argument that earnings growth linked to artificial intelligence could send shares higher
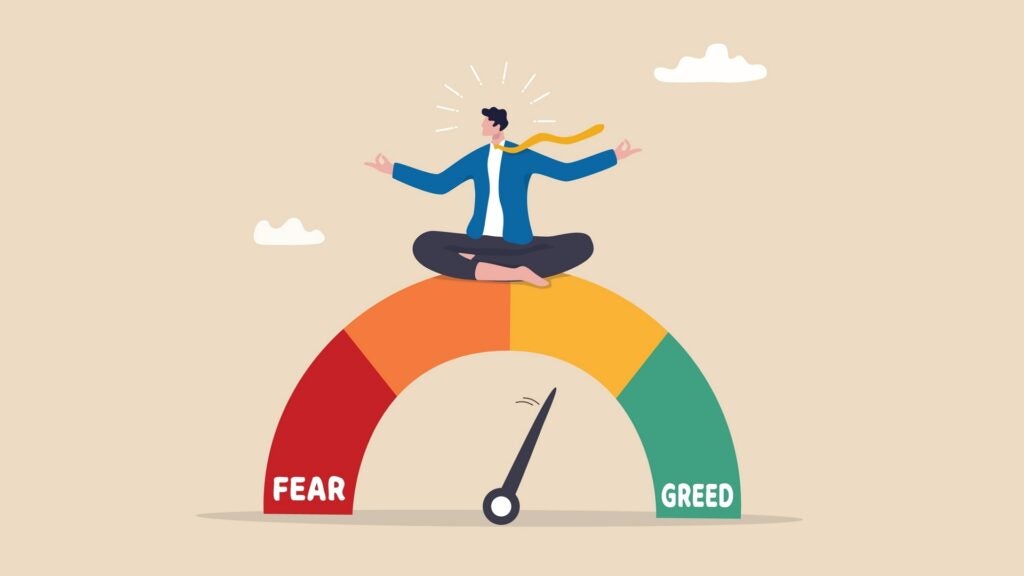
S&P 500 Falls For Fourth Session But Records Gains In 2025: Investor Sentiment Declines, Fear & Greed Index Remains In 'Neutral Zone
The CNN Money Fear and Greed index showed further decline in the overall market sentiment, while the index remained in the “Neutral” zone on Wednesday.

20 stocks in the S&P 500 that gained the most in 2025
As we near the end of another excellent year for the broad U.S. stock market, it is time to show a list of the best performers in the S&P 500, but also to put the market's gains into some perspective.




