



iShares Core S&P 500 ETF (IVV)







Some Experts Say Stocks Still Look Cheap—Even With the S&P 500 Near Its Record High
The S&P 500 isn't far off its record high. But some experts say fast-growing profits mean many stocks still look cheap.
Banking titan shares new bullish S&P 500 outlook
Bank of America has issued a new S&P 500 forecast, projecting the benchmark index will reach 7,800 over the next 12 months.
This Analyst Says A Full Reversion to the Mean Would Take the S&P 500 From 7,000 to 2,500
A veteran portfolio manager pulled out a century-long logarithmic chart and pointed to where the S&P 500 sits today, then explained why that picture changes everything about how you should think about risk depending on your age.

The S&P 500 Awaits Its Next Major Market Catalyst
“The Stock Market's Breezy Summer Is Over.

Rosenbluth Talks Vanguard 50-Year Milestone & Record Pacing ETF Inflows
On September 2, TMX VettaFi Head of Research Todd Rosenbluth appeared on the Schwab Network to discuss ETF inflows nearing record highs in 2026 and the 50th anniversary of the first-ever index fund, the Vanguard 500 Index Fund.
Strategists say S&P 500 could top 8,000 — but risks of a pullback are mounting
While RBC Capital Markets, HSBC and Barclays all have price targets for the stock index around 8,000, they outline risks the market is facing.

S&P 500 Earnings: Expected 2027 EPS Growth Might Make For A Tougher Year
Q2 '26 S&P 500 EPS growth is currently estimated to be 53%, until the Anthropic non-operating mark-ups are removed from Alphabet and Amazon, which reduces the growth to a still-quite robust 34.9% for Q2 '26. The forward P/E is still 20x down from 23x in early January '26. Remarkably, the S&P 500 “earnings yield” ended last week at 4.97%, still hovering around 5% - a yield level which drove a strong S&P 500 rally in early March '26. The rising 10-year Treasury yield is still below the 4.80% recent high and the 4.998% peak in late '23, after the FOMC rate hikes. A trade above 5% for the 10-year Treasury yield will likely have a marked impact on stocks.
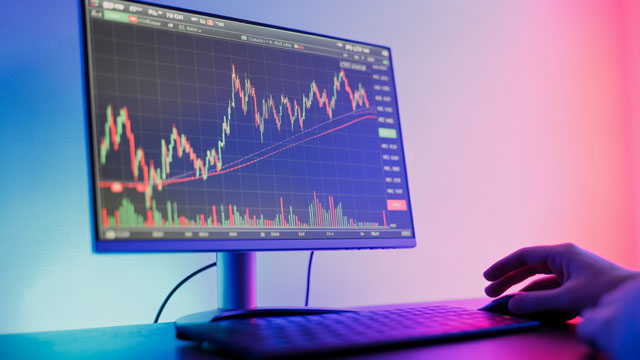
Why you need to invest in the S&P 500 now
Investors waiting for a market pullback may have reached one of the best buying opportunities of the year.
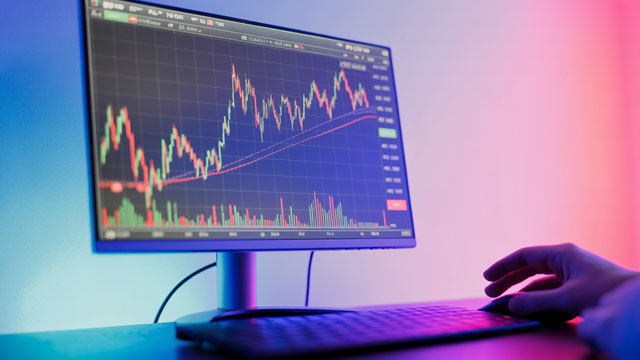
S&P 500 Forecast: Strong Jobs Data and Trump Tariffs Test the Path to 8,000
The S&P 500 faces short-term uncertainty from tariffs and rate hike risks, but its broader outlook remains bullish above 7,620.

Why the S&P 500 could defy the 'September Effect' this year
The US stock market enters September with strong momentum but faces a familiar seasonal test, as the S&P 500 heads into a month that has historically delivered the weakest average returns of the year. The benchmark gained 2.6% in August, its strongest August performance since 2021, and is up 12.3% in 2026.
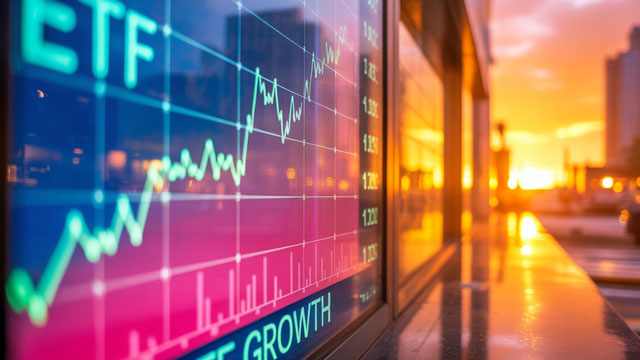
The S&P 500 usually falls in September. Why this year should be different.
As U.S. stocks head into September, a key trading level suggests the S&P 500 could dodge a big loss in what is historically a turbulent month.
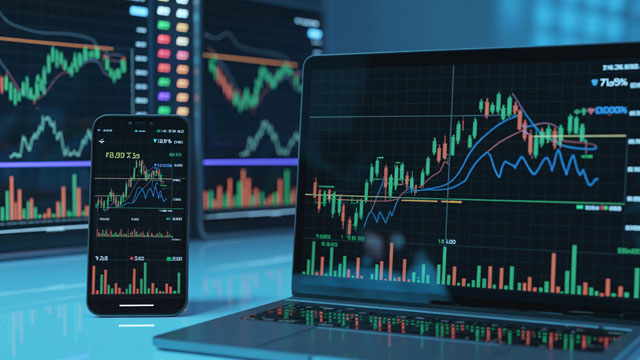
Why My 3 Worst Picks Beat The S&P 500 In Retirement
Internet total return charts assume 100% reinvestment and zero withdrawals, a luxury working investors have that retirees living off their savings do not. The "D-List" Stress Test: A look at three individually underperforming picks that absorbed multiple dividend cuts, suspensions, and a +50% drop in share prices for two of the three holdings. When you start assuming withdrawals, even "bad" income picks outperform a portfolio forced to sell at low prices.




