



SPDR S&P Oil & Gas Exploration & Production ETF (XOP)




Summary
XOP Chart
People also search for

Energy ETF (XOP) Hits New 52-Week High
State Street SPDR S&P Oil & Gas Exploration & Production ETF XOP is probably on the radar for investors seeking momentum. The fund just hit a 52-week high and has surged 62.3% from its 52-week low price of $122.11 per share.

Oil Just Blew Past $100 a Barrel and These 5 Energy Stocks Are in the Line of Fire.
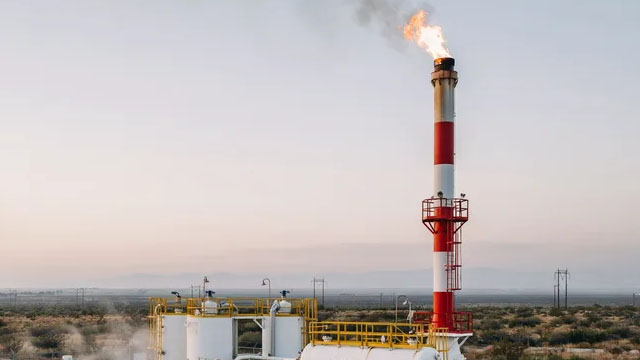
With Brent crude punching back above $100 on US military strikes against Iranian tankers, five energy stocks suddenly face very different fortunes depending on where they sit in the supply chain.
Is State Street SPDR S&P Oil & Gas Exploration & Production ETF (XOP) a Strong ETF Right Now?
Designed to provide broad exposure to the Energy ETFs category of the market, the State Street SPDR S&P Oil & Gas Exploration & Production ETF (XOP) is a smart beta exchange traded fund launched on 06/19/2006.
SPDR S&P Oil & Gas Exploration & Production ETF Investors
| Name | Quantity | Cost | Value | Profit ($) | Gain (%) |
|---|---|---|---|---|---|
| TJD Thomas John Drogan PR Inc.IPAL SECURITIES Inc. | 6,270 | $809,912.3 | $1.22M | $412,048 | 50.88% |
 Curtis Ellergodt Rothschild Investment LLC | 253 | $34,638 | $50,053.52 | $15,415.52 | 44.5% |
| BZ Brandon Zatopek Commonwealth Equity Services LLC | 55,357 | $8.54M | $10.95M | $2.41M | 28.25% |
| JD Jim Dushek HARBOUR INVESTMENTS Inc. | 1,423 | $258,744.09 | $281,526.32 | $22,782.23 | 8.8% |
| DH Daniel Hanuka MIRAE ASSET SECURITIES USAA) Inc. | 650,000 | $116.56M | $128.6M | $12.03M | 10.32% |
SPDR S&P Oil & Gas Exploration & Production ETF (XOP) FAQ
What is the stock price today?
On which exchange is it traded?
What is its stock symbol?
Does it pay dividends? What is the current yield?
What is its market cap?
Has SPDR S&P Oil & Gas Exploration & Production ETF ever had a stock split?
SPDR S&P Oil & Gas Exploration & Production ETF Profile
| ARCA Exchange | US Country |
Overview
The company in focus operates as an investment fund that aims to replicate the performance of the S&P Oil & Gas Exploration & Production Select Industry Index. To achieve this objective, the fund employs a sampling strategy. This means that while it aims to invest most of its assets in the securities that make up the index, it may not hold all the securities in the exact proportions as they appear in the index. The policy of the fund mandates that at least 80% of its total assets are invested in the securities of the index. The S&P Oil & Gas Exploration & Production Select Industry Index, which the fund tracks, is a subset of the S&P Total Market Index (S&P TMI). This index specifically represents the oil and gas exploration and production sector, highlighting companies engaged in the exploration, extraction, and production of oil and natural gas.
Products and Services
- Investment in Oil & Gas Sector
The primary product offered by the fund is an investment vehicle that allows investors to gain exposure to the oil and gas exploration and production industry. By investing in this fund, shareholders indirectly invest in a portfolio of companies that are part of the S&P Oil & Gas Exploration & Production Select Industry Index. This includes a range of companies from those involved in the early stages of exploration to those engaged in the extraction and production of oil and natural gas. The fund's strategy involves a sampling approach to the index it tracks, meaning it selects a portion of the index's securities to achieve a similar performance, rather than replicating the index exactly. This method provides investors with a diversified exposure to the oil and gas sector, potentially mitigating risks associated with investing in individual stocks within this volatile industry.
Contact Information




