



Darden Restaurants, Inc. (DRI)









Darden Restaurants (DRI) Reports Q4 Earnings: What Key Metrics Have to Say
Although the revenue and EPS for Darden Restaurants (DRI) give a sense of how its business performed in the quarter ended May 2026, it might be worth considering how some key metrics compare with Wall Street estimates and the year-ago numbers.
Darden Restaurants (DRI) Q4 Earnings Beat Estimates
Darden Restaurants (DRI) came out with quarterly earnings of $3.66 per share, beating the Zacks Consensus Estimate of $3.63 per share. This compares to earnings of $2.98 per share a year ago.

Darden Restaurants earnings beat estimates but Olive Garden growth weakens
Darden Restaurants reported better-than-expected quarterly earnings, but its revenue missed Wall Street's estimates. Same-store sales growth at the company's fine-dining restaurants and Olive Garden fell short of expectations.
Darden Gears Up for Q4 Earnings: What's in Store for the Stock?
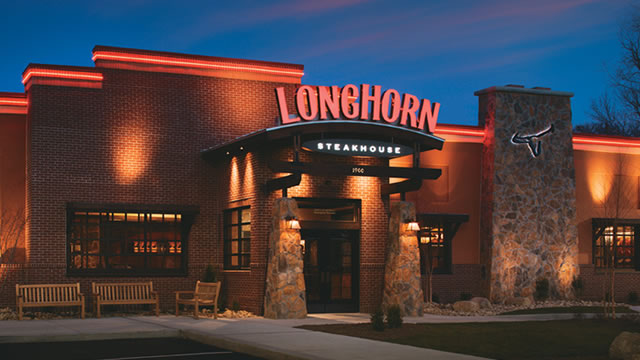
DRI heads into Q4 earnings with sales momentum at Olive Garden and LongHorn, but beef inflation and investments may pressure margins.
Darden Restaurants: Everything You Need To Know Before Q4 Earnings
Darden Restaurants remains a top full-service restaurant pick, with operational strength led by Olive Garden and LongHorn Steakhouse. Despite trading at ~20x earnings, DRI offers a projected 10%+ total return, supported by resilient margins and industry outperformance. FY 2027 guidance suggests robust sales and EPS growth, but elevated Capex will temporarily reduce free cash flow and buyback yield.
Countdown to Darden Restaurants (DRI) Q4 Earnings: A Look at Estimates Beyond Revenue and EPS
Beyond analysts' top-and-bottom-line estimates for Darden Restaurants (DRI), evaluate projections for some of its key metrics to gain a better insight into how the business might have performed for the quarter ended May 2026.
Darden Restaurants (DRI) Reports Next Week: Wall Street Expects Earnings Growth
Darden Restaurants (DRI) possesses the right combination of the two key ingredients for a likely earnings beat in its upcoming report. Get prepared with the key expectations.
Darden Stock Rises 17% in 6 Months: Should You Buy the Stock Now?
Shares of Darden Restaurants, Inc. DRI have gained 16.7% over the past six months, outperforming 0.3% growth in the Zacks Retail - Restaurants industry. The stock has also surpassed the broader Retail-Wholesale sector's rise of 2.5% and the S&P 500 index's 11.5% growth during the same period.
Is Darden Restaurants (DRI) Stock Outpacing Its Retail-Wholesale Peers This Year?
Here is how Darden Restaurants (DRI) and Victoria's Secret (VSCO) have performed compared to their sector so far this year.
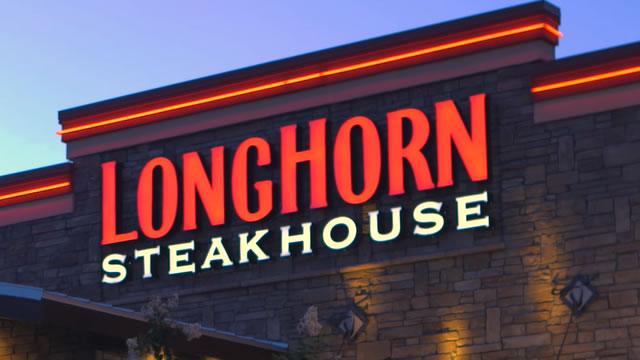
DRI's LongHorn Shines With 7.2% Comps: Can This Lead Growth?
DRI's LongHorn Steakhouse posts 7.2% comps, beating industry trends with strong traffic, value appeal and execution, positioning it as a key growth driver.
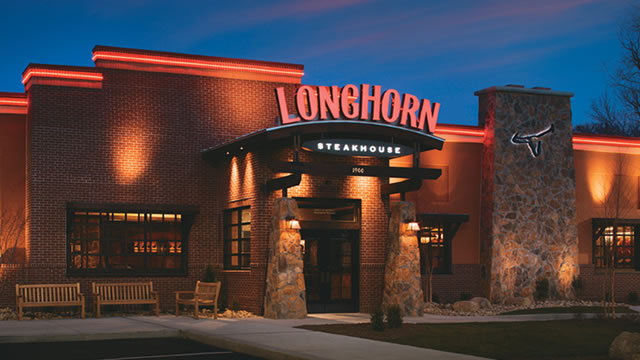
Can AI and Forecasting Tools Boost Darden's Restaurant Efficiency?
DRI taps AI and forecasting tools to sharpen restaurant efficiency, boosting labor planning, reducing waste and improving service without replacing workers.
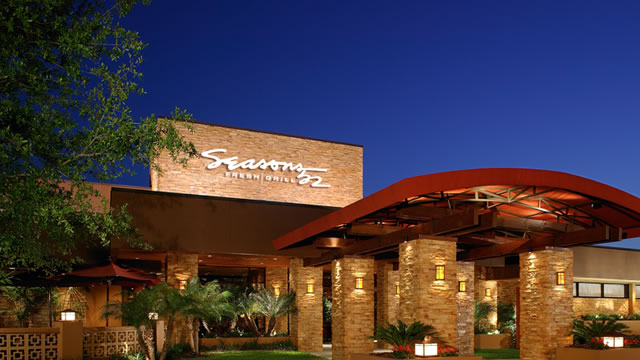
Should Investors Be Drawn to the Cheap Valuation of Darden Stock?
DRI trades at a discount with steady comps growth and solid traffic, but margin pressure and macro uncertainty temper its near-term upside.




