
iShares 7-10 Year Treasury Bond ETF (IEF)

S&P 500 Snapshot: Seesaw Week Ends Higher
The S&P 500 ended a choppy week on Wall Street higher, finishing up 1.5% from last Friday. The index is currently 0.58% off its record high from July 16th, 2024 and is now up 18.80% year to date.

Treasury Yields Snapshot: August 23, 2024
The yield on the 10-year note ended August 23, 2024 at 3.81%, the 2-year note ended at 3.90%, and the 30-year at 4.10%. Here is a table showing the yields' highs and lows and the FFR since 2007.
Treasury Yields Snapshot: August 16, 2024
The yield on the 10-year note ended August 16, 2024 at 3.89%, the 2-year note ended at 4.06%, and the 30-year at 4.15%. Here is a table showing the yields' highs and lows and the FFR since 2007.
S&P 500 Snapshot: Best Week of 2024
The S&P 500 experienced its best week since November 2023, finishing up 3.9% from last Friday. The index is currently 1.99% off its record high from July 16th, 2024 and is now up 17.11% year to date.

Treasury Yields Snapshot: August 16, 2024
The yield on the 10-year note ended August 16, 2024 at 3.89%, the 2-year note ended at 4.06%, and the 30-year at 4.15%. Here is a table showing the yields' highs and lows and the FFR since 2007.

Treasury Yields Snapshot: August 9, 2024
The yield on the 10-year note ended August 9, 2024 at 3.94%, the 2-year note ended at 4.05%, and the 30-year at 4.23%. Here is a table showing the yields' highs and lows and the FFR since 2007.
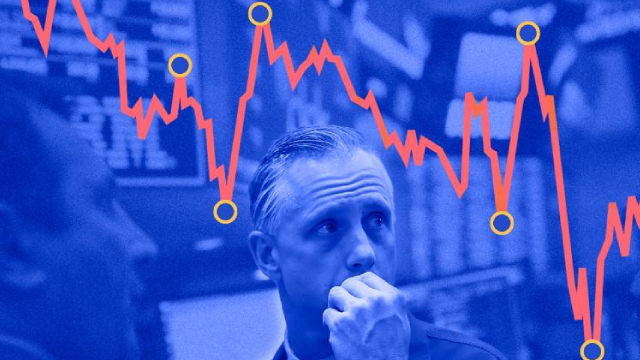
S&P 500 Snapshot: Volatile Week Comes to a Close
This week, the S&P 500 experienced one of its worst daily performances since 2022, followed by one of its best. Despite the volatility, the index posted a slight loss of just 0.04% compared to last week.
Treasury Yields: A Long-Term Perspective – July 2024
This article looks at a long-term perspective on Treasury yields. The chart below shows the 10-year constant-maturity yield since 1962 along with the Fed funds rate (FFR) and inflation.
S&P 500 Snapshot: Index Slumps to 2-Month Low
The S&P 500 fell for a third straight week and dropped to its lowest close in almost two months on Friday. The index is currently 5.66% off its record high from July 16th, 2024 and is now up 12.73% year to date.

IEF: A Compromise Between Yield And Duration
IEF ETF offers decent yield, high liquidity, and acceptable expense ratio. IEF ETF benefits from rate cuts with less volatility compared to long-term bonds and with higher returns compared to short-term bonds. However, for some investors such a compromise may be a deal-breaker in picking an intermediate-term bond ETF like the IEF.
S&P 500 Snapshot: Index Falls for Second Straight Week
For the first time in over three months, the S&P 500 fell for a second straight week as it finished down 0.83% from last Friday. The index is currently up 16.10% year to date and has recorded a new all-time high 38 times this year.

S&P 500 Snapshot: Taking a Breather
The S&P 500 fell 2.0% this week, its largest weekly drop since April. The index is currently up 16.07% year to date and has recorded a new all-time high 38 times this year.


