If you track your investments online or through an app, you’ve probably seen the term “Unrealized P/L” (Profit/Loss) next to your stocks or funds. It’s a number that updates in real time, flashing green or red, and it can feel like a scorecard for your investing skills. But what is this number actually telling you—and what isn’t it telling you?
What Is Unrealized P/L?
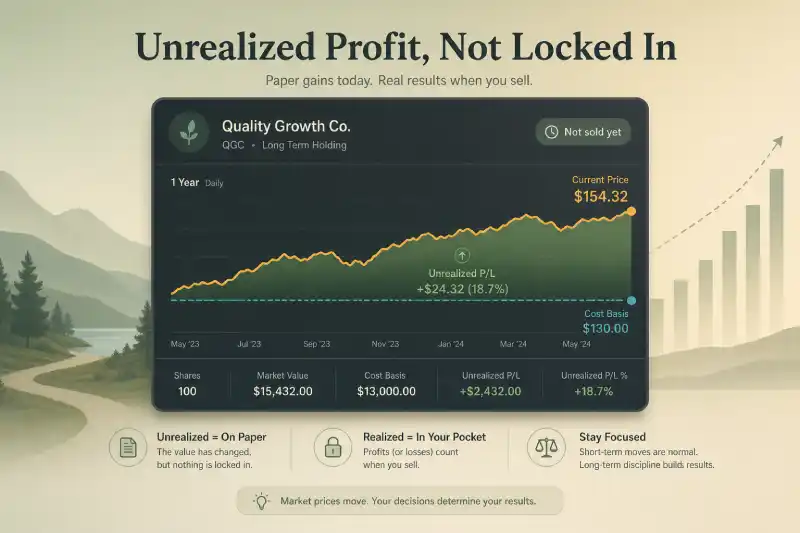
Unrealized P/L, or “paper” profit/loss, reflects the difference between the current market value of your holdings and the price you originally paid for them. It’s called “unrealized” because you haven’t actually locked in the gain or loss—your position is still open. If you sold your shares right now, the unrealized P/L would become realized.
For example, if you bought 10 shares of a stock at $50 each (total $500), and the current price is $60, your unrealized profit is $100. If the price drops to $45, your unrealized loss is $50. But until you sell, these numbers are just snapshots of what could be, not what is.
Why Does Unrealized P/L Matter?
Unrealized P/L gives you a sense of how your investments have performed since you bought them. It’s a useful tool for performance analysis and can help you decide whether to hold, sell, or buy more. However, it’s only part of the story.
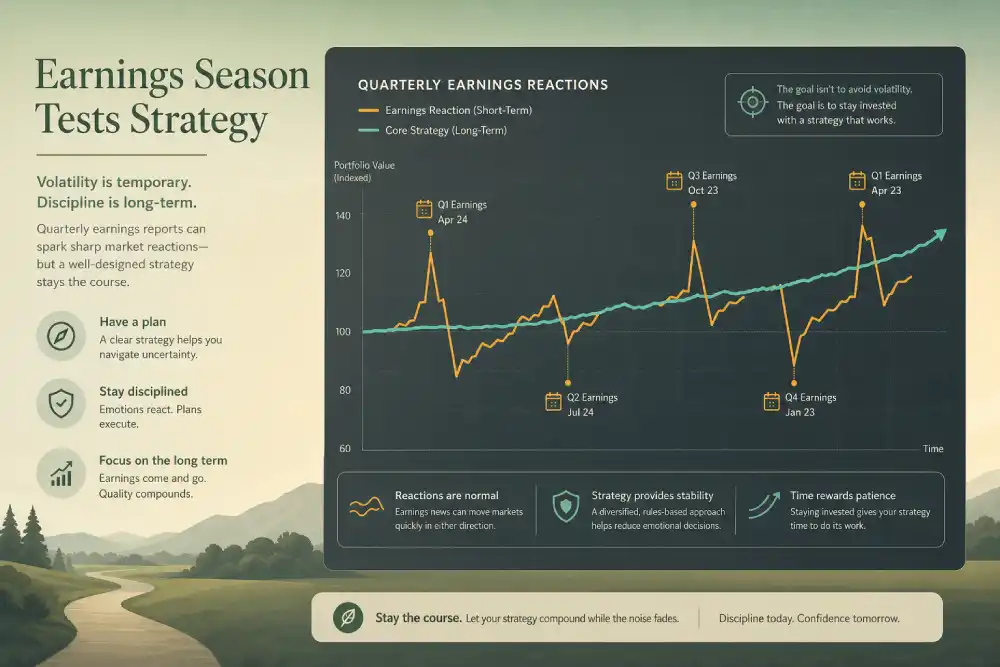
Because the market is constantly moving, your unrealized P/L can swing wildly day to day. It’s tempting to react emotionally, but remember: this number isn’t money in your pocket yet. It’s a potential outcome, not a guarantee.
The Role of Cost Basis
To understand your unrealized P/L, you need to know your cost basis—the amount you paid for your shares, including commissions or fees. Without an accurate cost basis, your profit or loss calculation can be misleading. For a deeper dive into this foundational concept, see What “Cost Basis” Really Means in Your Portfolio.
Unrealized P/L and Portfolio Tracking
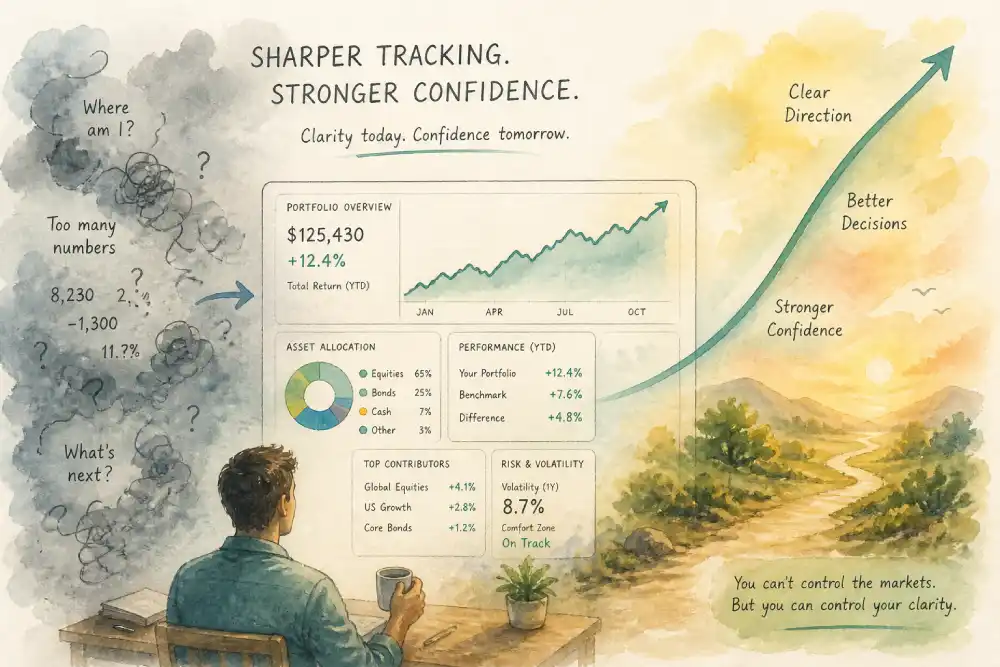
Most portfolio dashboards display both unrealized and realized gains. This distinction is crucial for portfolio tracking and helps prevent common misconceptions—like assuming a green number means you’re actually “up” overall. Taxes, dividends, and other factors can affect your total return, which is why Portfolio Value and Total Return Don’t Match as neatly as you might expect.
Limitations of Unrealized P/L
- It’s not cash. You only realize gains or losses when you sell.
- It ignores dividends and interest. Unrealized P/L typically tracks price changes, not income generated.
- It doesn’t account for taxes. Your tax bill is based on realized gains, not paper profits.
- It can be misleading for multiple purchases. If you buy shares at different prices, your average cost basis changes, which can complicate the calculation.
How to Use Unrealized P/L Wisely
Rather than obsessing over day-to-day moves, use unrealized P/L as a checkpoint. Ask yourself:
- Is my investment thesis still valid?
- Am I reacting to short-term volatility or sticking to my plan?
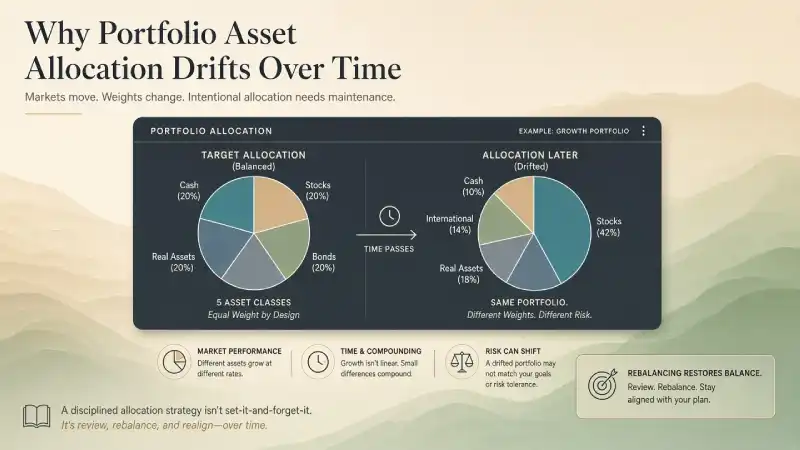
- Does my portfolio remain balanced according to my goals?
Consider combining this metric with other tools, such as time-weighted and money-weighted returns, to get a fuller picture of your performance.
The Bottom Line
Unrealized P/L is a useful signal, but it’s not the whole story. It tells you how much your investments have gained or lost on paper, but not what you’ve actually earned. For true insight, track both unrealized and realized returns, understand your cost basis, and remember the difference between market value and actual profit. By focusing on fundamentals—not just the flashing numbers—you’ll make better decisions and avoid common investing pitfalls.