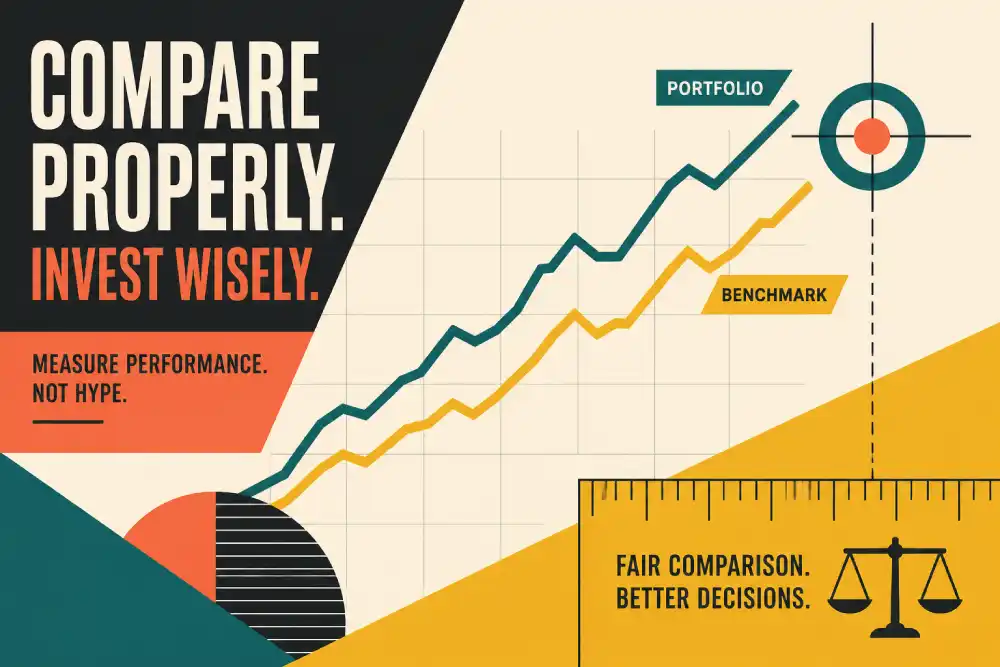
Comparing your investment portfolio to a benchmark is one of the most important steps in evaluating your performance as an investor. But it’s also one of the most commonly misunderstood. Done incorrectly, it can lead to false confidence or unnecessary anxiety. Done properly, it offers valuable insight into how your decisions stack up against the broader market and whether your strategy is truly adding value.
Why Compare to a Benchmark?
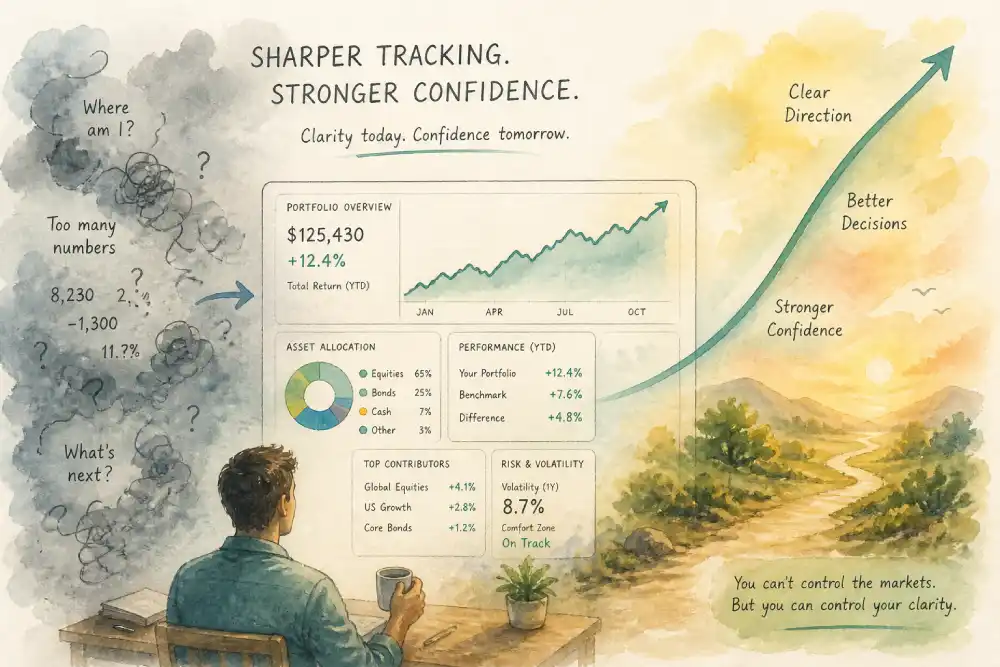
A benchmark is a reference point—often a market index like the S&P 500 or a blended index that matches your portfolio’s allocation. Comparing your portfolio to a benchmark helps you answer a fundamental question: Did your investments perform better or worse than simply buying the market?
This comparison isn’t just about bragging rights. It’s about understanding whether your investment choices, risk level, and timing are paying off, or if you’d be better off with a passive approach. For many investors, the First Time You Compare Yourself to the Market can be eye-opening, revealing strengths and weaknesses that may not be obvious just by looking at your account balance.
Step 1: Choose the Right Benchmark
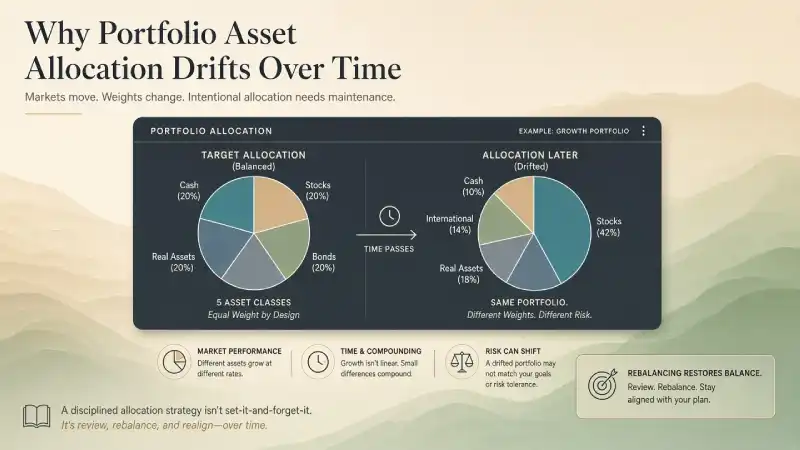
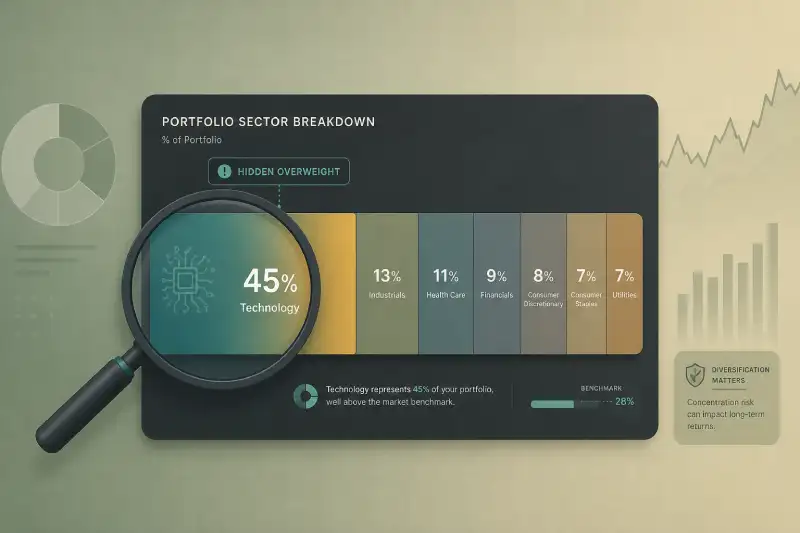
Your benchmark should reflect the risk and asset mix of your portfolio. If you invest only in US large-cap stocks, the S&P 500 makes sense. But if you hold a mix of stocks, bonds, and international assets, you’ll need a blended benchmark that mirrors your allocation. Comparing a tech-heavy portfolio to a broad index won’t give you a fair assessment—make sure your benchmark is a true apples-to-apples comparison.
Also, consider how Exchange Listings Affect Your Investments. If you hold international or emerging market stocks, your benchmark should include those markets as well, since their returns can differ significantly from domestic indices.
Step 2: Use the Right Return Calculation
It’s not enough to look at your dollar gain or loss. You need to measure your returns in a way that accounts for deposits, withdrawals, and the timing of your investments. The two most common methods are:
- Time-weighted return: Measures your portfolio’s return as if there were no external cash flows. This is ideal for comparing your performance to a benchmark, since it isolates the effect of your investment choices from the timing of your contributions or withdrawals.
- Money-weighted return (IRR): Takes into account the size and timing of cash flows. This shows your personal experience, but can be skewed by when you add or withdraw money.
For fair benchmarking, use time-weighted returns. This ensures your performance is measured on the same basis as the benchmark, which doesn’t receive your deposits or withdrawals.
Understanding how to Read Your Performance Graph Correctly can help clarify which return calculation you’re looking at and how it relates to your benchmark.
Step 3: Align Time Periods
Always compare returns over identical time frames. Looking at your one-year return versus the benchmark’s five-year return tells you nothing. Most brokerages and portfolio tools allow you to select custom date ranges—use these to ensure your comparison is apples-to-apples. If you started investing mid-year, compare from that date forward, not from the start of the calendar year.
Step 4: Account for Dividends and Fees
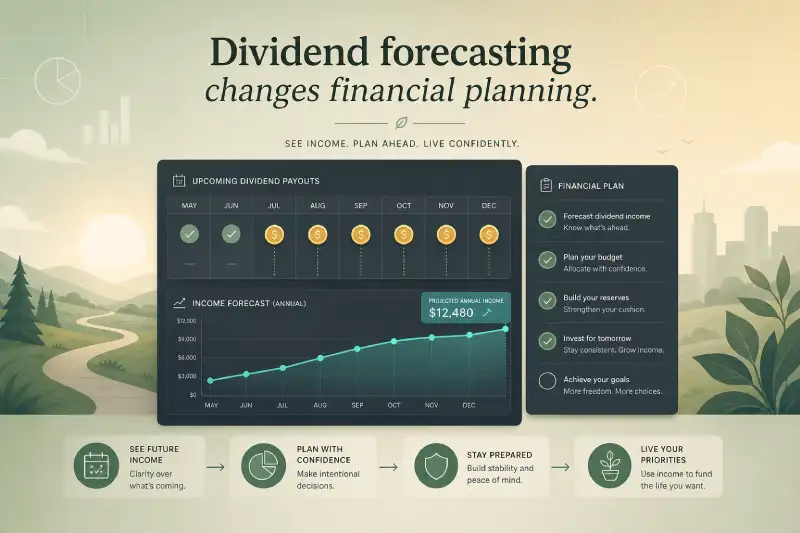
Benchmarks usually assume dividends are reinvested and don’t include transaction fees or taxes. To make a fair comparison, use your total return (including dividends) and, if possible, compare net of all fees. If your portfolio incurs significant trading costs or advisory fees, these should be reflected in your return, since they are a real drag on performance.
Step 5: Understand the Context
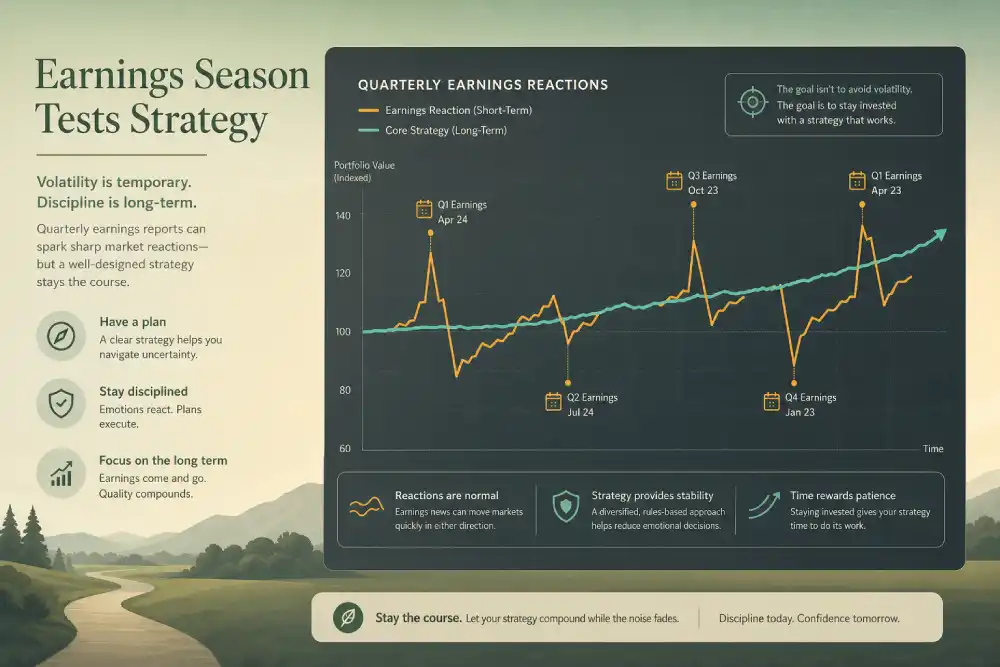
Be careful not to over-interpret short-term differences. Markets are noisy, and even a well-constructed portfolio can underperform its benchmark over short periods due to random fluctuations. Look for patterns over multiple years, and consider whether your strategy is taking more or less risk than the benchmark. If your portfolio is less volatile, some underperformance may be acceptable in exchange for lower risk.
Risk is a key dimension of performance. Understanding What Beta Means for Your Portfolio can help you assess whether your returns justify the level of risk you’re taking compared to the benchmark.
Common Pitfalls to Avoid
- Cherry-picking time periods: Only comparing periods where your portfolio outperformed gives a false sense of skill.
- Ignoring taxes: If you realize gains, taxes can erode your returns compared to a benchmark that doesn’t pay them. Learn more about the impact of Realized vs Unrealized Gains on your performance.
- Overlooking individual stock impacts: Sometimes a single stock can sway your results significantly. If you’re curious whether a position is helping or hurting, see How to Know If a Stock Is Carrying or Hurting You.
What to Do If You’re Underperforming
If your portfolio consistently lags its benchmark, don’t panic—use it as a learning opportunity. Review your decisions, asset allocation, and risk level. Are you taking unnecessary risks? Are your fees too high? Are you making emotional decisions? Sometimes, the best move is to simplify—consider a low-cost index fund if active management isn’t delivering results.
Final Thoughts
Comparing your portfolio to a benchmark is essential for honest self-assessment, but it must be done thoughtfully. Choose an appropriate benchmark, use time-weighted returns, align time periods, and account for dividends, fees, and taxes. Avoid common pitfalls, and always interpret results in context. Over time, this disciplined approach will help you become a more confident and effective investor.
For more on understanding your investment results, you might also want to explore What “Cost Basis” Really Means in Your Portfolio.